The paper behind this story
Scale Over Sticker Price
Request the full whitepaper
Tell me who you are and where you work. I’ll send the complete paper.
Sent to the author directly. No list, no forwarding, no third parties.
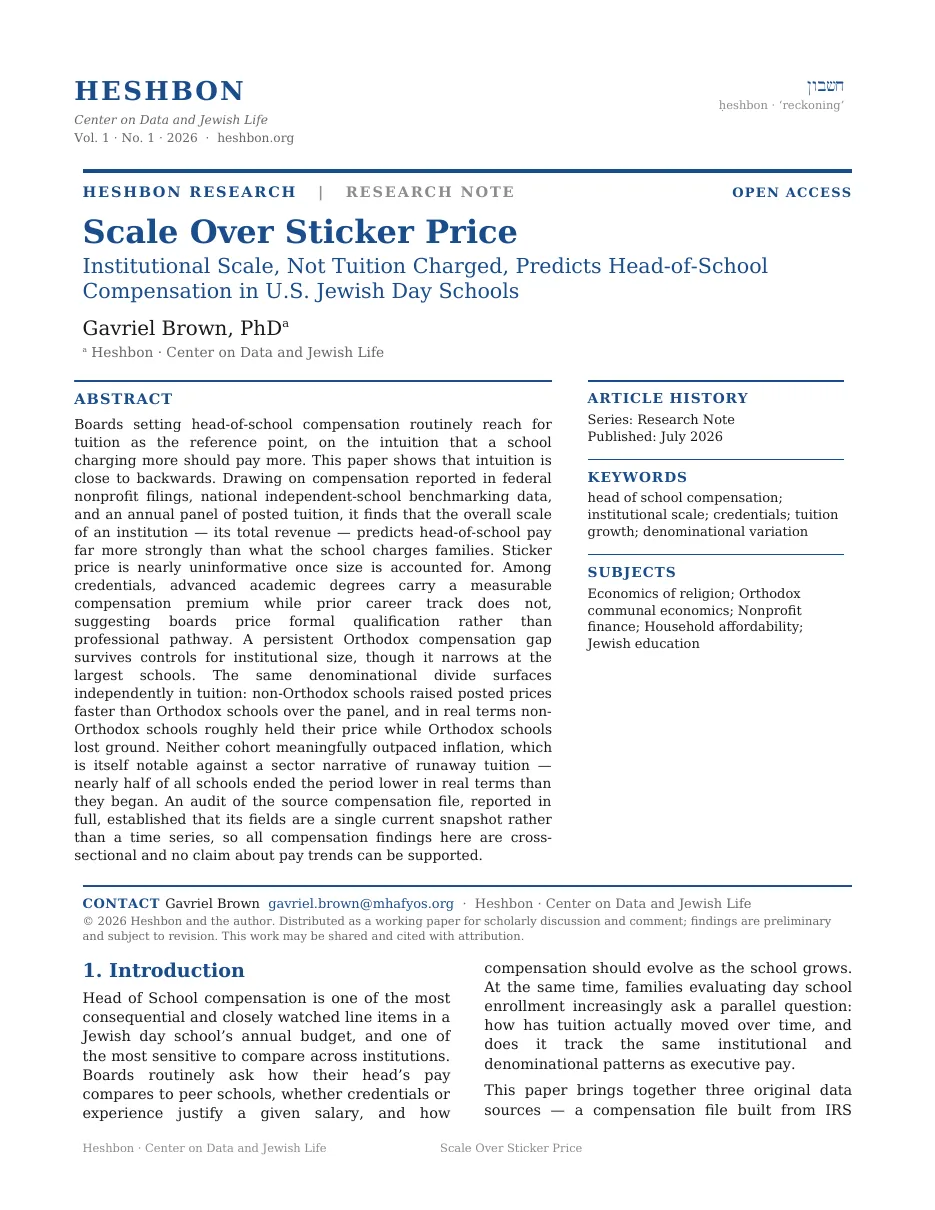
A school that charges more is expected to pay its head more. So we pulled Schedule J out of eight years of public Form 990 filings for 134 identified heads of school at 97 institutions, rebuilt the posted tuition at 165 schools from their own websites and archived captures of those pages, and asked which facts about a school actually move with the salary.
Two candidate anchors, one bar each, in the chart below. The length of a bar is the correlation between that number and what the head of school is paid, on a scale running from 0 at the left to 0.6 at the right. A correlation of 0 would mean the two numbers move independently of each other, and 1 would mean one of them tells you the other exactly. The rust bar is total school revenue. The slate bar under it is the tuition the school posts. Look at how much shorter the slate bar is.
An original dataset assembled by hand. Head-of-school compensation was parsed from Schedule J of public IRS Form 990 filings, and posted tuition was reconstructed from school websites, public web sources, and archived Internet Archive / Wayback captures of them across 2017–24. Both the pay record and the tuition panel were built filing by filing and page by page, then reconciled into one longitudinal record.
A comparable peer set of independent schools appears only as a secondary cross-reference where noted; the findings rest on the assembled record above.
Total institutional revenue correlates with head-of-school compensation at r = 0.60. Published tuition manages r = 0.15.
A board that reaches for the tuition schedule as its comparability anchor is reaching for close to the least useful number on the page. Scale is what the market appears to price. Sticker price rides along with the local economy instead, which is a separate fact about a separate thing.
Two schools can post the same tuition and pay their heads very differently, because a price and a size are separate facts.
Which facts about a school actually move with what its head is paid?
Total revenue and enrollment tier sit at the top of every predictor we tested. The features a board tends to treat as defining for the role sit well below them.
Five bars below, one for each thing we tested, ranked longest at the top. Bar length is the correlation with total compensation again, on the same scale from 0 to 0.6 as the chart in the hero. The bar drawn in rust is the one the current view is asking you to look at, and the slate bars are everything else. The three buttons change which bar goes rust; under Scale dominates and Credentials, not pathway, the rows a lens is not about fade almost out of the picture rather than disappear, so the ranking stays visible.
Notice where published tuition falls in the order.
Every predictor we tested, ranked by correlation with pay.
Ask what schools charging what we charge pay, and the data answers badly. Ask what schools our size pay, and it answers four times as well.
Tuition turns out to be the weak predictor. Has it at least been moving?
The Orthodox compensation gap survives controls for institutional size. In a separate dataset, Orthodox schools also raised posted tuition more slowly. Two unrelated measures point in the same direction.
Two bars below, one per cohort, on a scale of percentage growth in posted tuition across the panel window. The vertical line at 0% is where a school finishes exactly where it started, so a bar running right of that line is an increase and a bar running left of it is a decrease. Non-Orthodox is the slate bar, Orthodox the rust one. Nominal shows the growth in posted dollars. Real subtracts consumer-price inflation from the same two numbers.
Watch the rust bar cross to the other side of the zero line when you press Real.
Headline growth in posted dollars.
Why does a tuition figure travel so badly from one school to the next?
The instinct behind the tuition benchmark is not foolish. A school charging $33,207 is a different institution from one charging $10,600, and the correlation between posted tuition and pay is positive rather than zero.
What a tuition figure also carries is the price of everything else where the school stands. Posted tuition runs from about $33,207 in California to $10,600 in Quebec, a spread of more than three to one that tracks local cost of living. A tuition figure encodes a school's market as much as its ambition, which is why it travels poorly as a comparability anchor for pay.
Each square in the grid below is one state or province, set roughly in its place on the map, with its two-letter abbreviation and its median posted tuition rounded to the nearest thousand printed inside. Every square is the same size, so only the shading carries the number: a square is filled with rust in proportion to its median, from the palest at $10,600 to fully saturated at $33,207. Squares left blank are places without enough reporting schools to post a median at all.
Find the darkest tile, then the palest filled one, and read the two figures inside them.
So: does tuition predict the pay?
Barely, at r = 0.15. Total revenue predicts it four times as well, at r = 0.60, with enrollment tier close behind at 0.44. The question boards tend to ask, what do schools charging what we charge pay, is answered poorly by the data. The question they could ask, what do schools our size pay, is answered four times as well.
Sticker price bundles a school's local market into a single number, so it makes for an unreliable yardstick for compensation. Total revenue, with enrollment behind it, is where the signal sits.
An audit found that the source compensation fields are a single current snapshot back-filled across historical rows. Every compensation finding here is cross-sectional rather than a trend over time.
The cross-referenced institutional analysis rests on 25 schools, of which only 15 to 17 carry complete tuition and giving data.
Denominational classification matched 94 of 165 panel schools, which leaves a thin Orthodox cell of 11. Read the denominational contrast as direction rather than magnitude.
Nothing here identifies how boards actually reason. It describes what the resulting numbers look like once the filings are collapsed and compared.
An original dataset assembled by hand. Head-of-school compensation was extracted from Schedule J of public IRS Form 990 filings, 2017–2024, then collapsed to one record per uniquely identified head after correcting frozen-snapshot and entity-resolution problems.
Posted tuition was assembled directly from school websites and archived Internet Archive / Wayback captures into a 165-school panel, deflated by June CPI-U. Map tiles show median posted tuition by state and province. Where noted, the institutional figures were cross-referenced against a peer set of comparable independent schools; the findings rest on the hand-built record.
From Scale Over Sticker Price, Gavriel Brown, PhD, research note, July 2026.
The paper behind this story
Tell me who you are and where you work. I’ll send the complete paper.
Sent to the author directly. No list, no forwarding, no third parties.
A data project on how Jewish life is paid for. The work comes in seasons. This page is part of Season 1 — Jewish Education. It states its own sources, sample sizes and limits.
Ahead: Season 2 — Household Affordability · Season 3 — Federation & Charitable Giving
Working prototype. Every figure comes from the underlying research. Where a chart simplifies a published result, the page says so. Nothing here audits an individual school.